Microsoft Ignite has offered us some, highly expected, new functions for Azure Information Protection. And one of the most requested is now in preview: a dashboard.
Not to long ago, I wrote a blog on the possibilities to create your own Azure Information Protection dashboard. It was quick and dirty, but it worked 🙂
But now Ignite has provided us with information on a new preview function: a fully functioning dashboard. Yeah! Let’s take a look. But do note that is still a preview function!
Let’s start at the beginning, the prerequisites. This information is from the Microsoft’s article on the subject.
Prerequisites for Azure Information Protection analytics
To view the Azure Information Protection reports and create your own, make sure that the following requirements are in place.
| Requirement | More information |
|---|---|
| An Azure subscription that includes Log Analytics | See the Azure Log Analytics pricing page.
If you don’t have an Azure subscription or you don’t currently use Azure Log Analytics, the pricing page includes a link for a free trial. |
| The current preview version of the Azure Information Protection client. | If you haven’t already installed the current preview version of the client, you can download and install it from the Microsoft Download Center. |
| For the Discovery and risk report:
– You have deployed at least one instance of the Azure Information Protection scanner (current preview version) |
For installation instructions, see Deploying the Azure Information Protection scanner to automatically classify and protect files.
If you’re upgrading from a previous version of the scanner, see Upgrading the Azure Information Protection scanner. |
Log analytics
Wow, this is nice. This is the same feature I used for my earlier post 🙂 You will need to create your own log analytics workspace. This is used to collect the Azure Information Protection data.
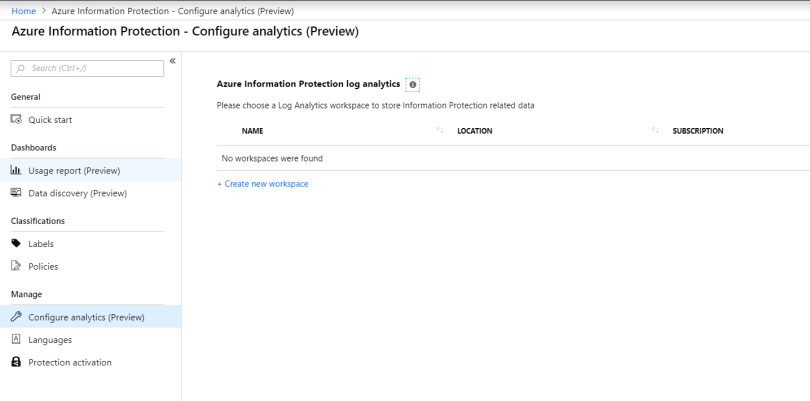
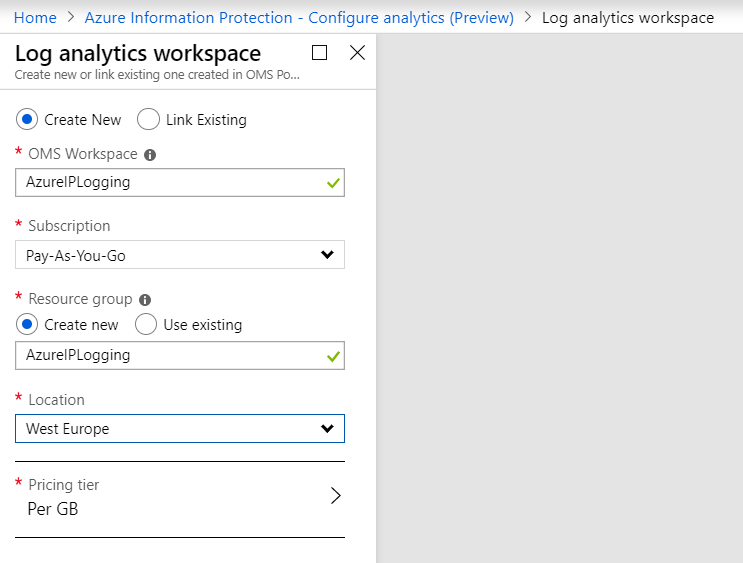
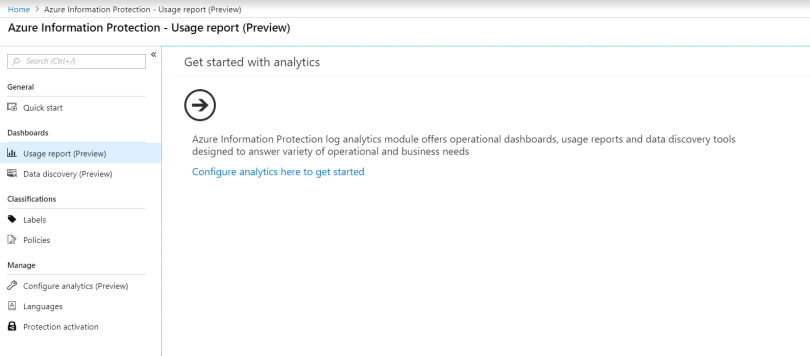
After this, you’re basically set and good to go. Just follow the steps to get started, and the dashboard will start to fill with information. Do note, that you will need the latest preview client to be able to use this function.
Under the hood
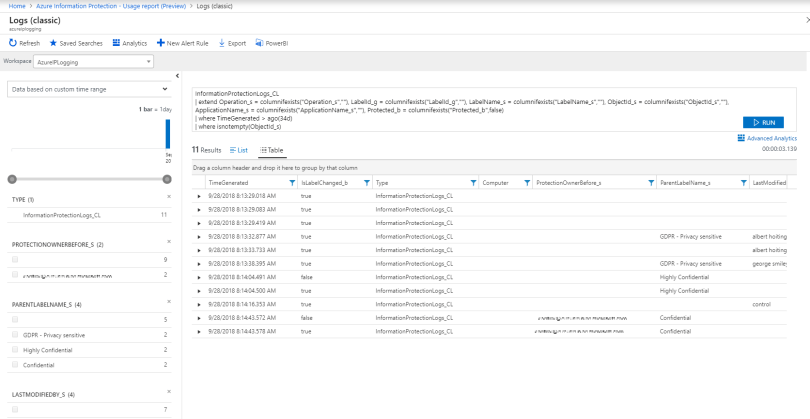
If you should look at the queries used by log analytics to retrieve the information, this is what you would find.
You can find this query and the results from the dashboard. These results offer a lot of information themselves. For example.
What about the results?
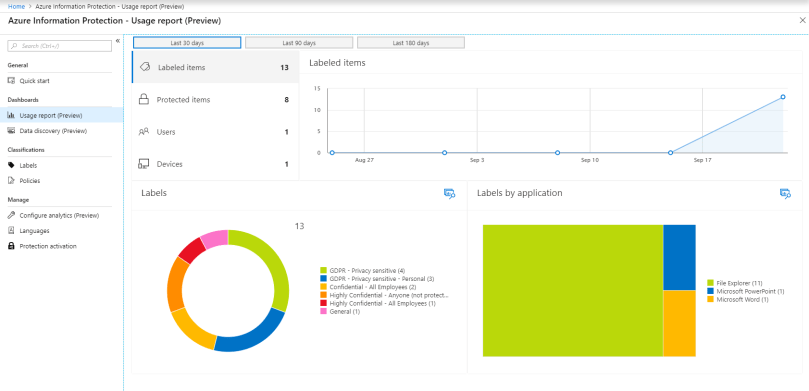
Ok. Want to see it in action? Here’s my dashboard after I classified and protected several documents using the preview client. Works like a charm!
Usage reports show you the actions from the client. Data discovery shows you the actions from the Azure Information Protection scanner.
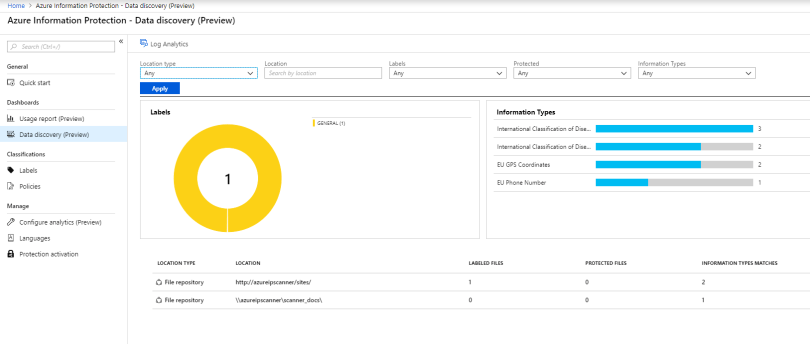
Nice to see that my scanner is both scanning fileshares and SharePoint 2016 🙂
Want more information?
These sessions from Ignite are highly recommended.
One comment